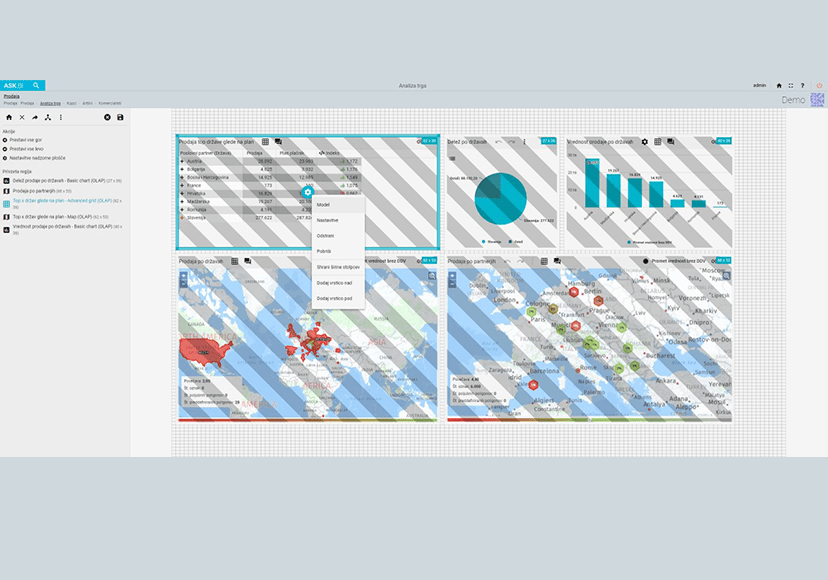
Users can design their own dashboards, define elements, rights, place them in menus. The editor allows adding different widgets. Data can be displayed graphically, tabularly, on a map. It is also possible to embed web pages, documents, insert links to other web pages.
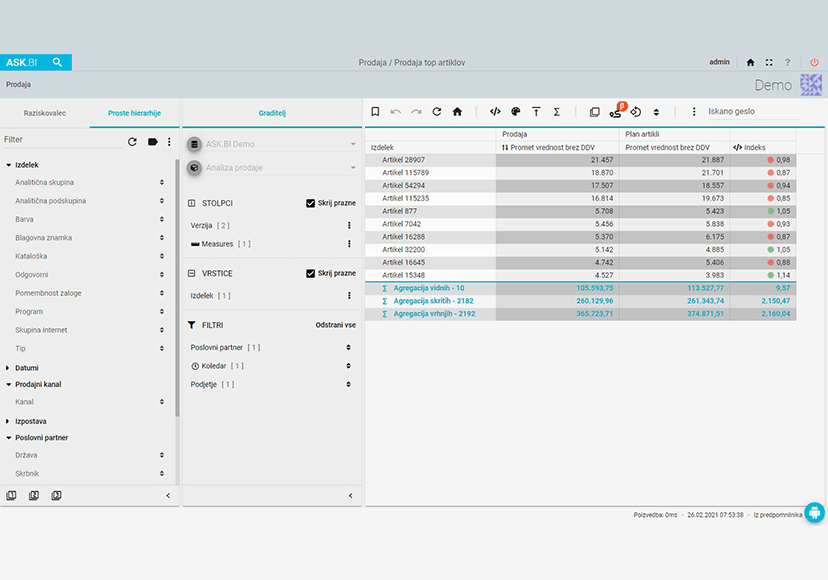
OLAP client (OnLine Analytical Processing
These are data structures designed to quickly view data stored in an OLAP database.
A database (warehouse) is best thought of as one of the Excel spreadsheets. So we have 2 dimensions: columns and rows. Because of this way of storing, these databases are also called relational databases.
The principle of the cube itself is very similar to that of pivot tables in Excel, allowing the user to produce even more complex reports using only the mouse.
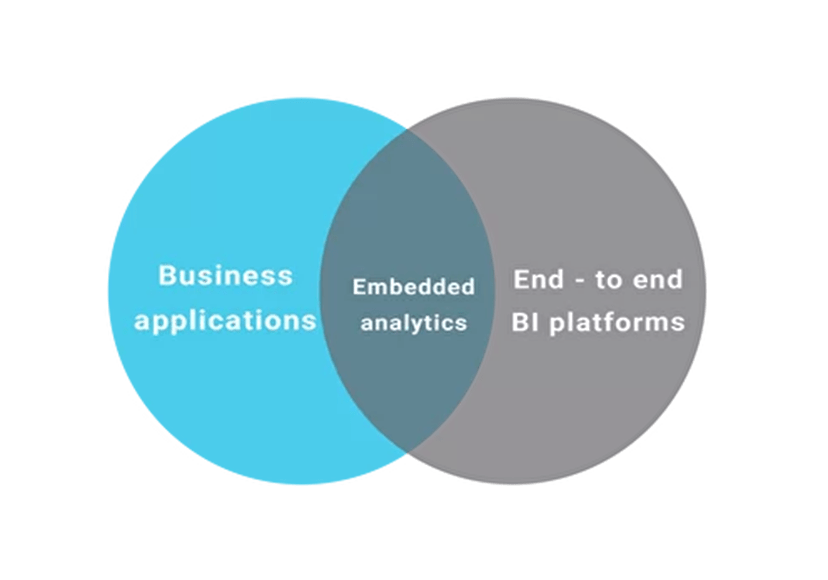
Embedded analytics
The ASK.BI platform is a powerful environment where we bring data from different sources: OLAP, SQL queries, APIs, IoT. The solution can be used as an enterprise analytics platform, but it can also be used as an analytics solution for another system. All dashboards can be embedded in another system, which is very important when we want users to use only one solution.
Example: a company is developing an MES system that reads data from machines and devices. The data is stored in a database and ASK.BI displays (visualises) it accordingly. Each company does its own part of the business it handles.
We use cookies on our website to give you the most relevant experience by remembering your preferences and repeat visits. By clicking “Accept All”, you consent to the use of ALL the cookies. However, you may visit "Cookie Settings" to provide a controlled consent.
This website uses cookies to improve your experience while you navigate through the website. Out of these, the cookies that are categorized as necessary are stored on your browser as they are essential for the working of basic functionalities of the website. We also use third-party cookies that help us analyze and understand how you use this website. These cookies will be stored in your browser only with your consent. You also have the option to opt-out of these cookies. But opting out of some of these cookies may affect your browsing experience.
Necessary cookies are absolutely essential for the website to function properly. These cookies ensure basic functionalities and security features of the website, anonymously.
Functional cookies help to perform certain functionalities like sharing the content of the website on social media platforms, collect feedbacks, and other third-party features.
Performance cookies are used to understand and analyze the key performance indexes of the website which helps in delivering a better user experience for the visitors.
Analytical cookies are used to understand how visitors interact with the website. These cookies help provide information on metrics the number of visitors, bounce rate, traffic source, etc.
Advertisement cookies are used to provide visitors with relevant ads and marketing campaigns. These cookies track visitors across websites and collect information to provide customized ads.